 P
P Where US Aviation Maintenance Capacity Is Thinnest
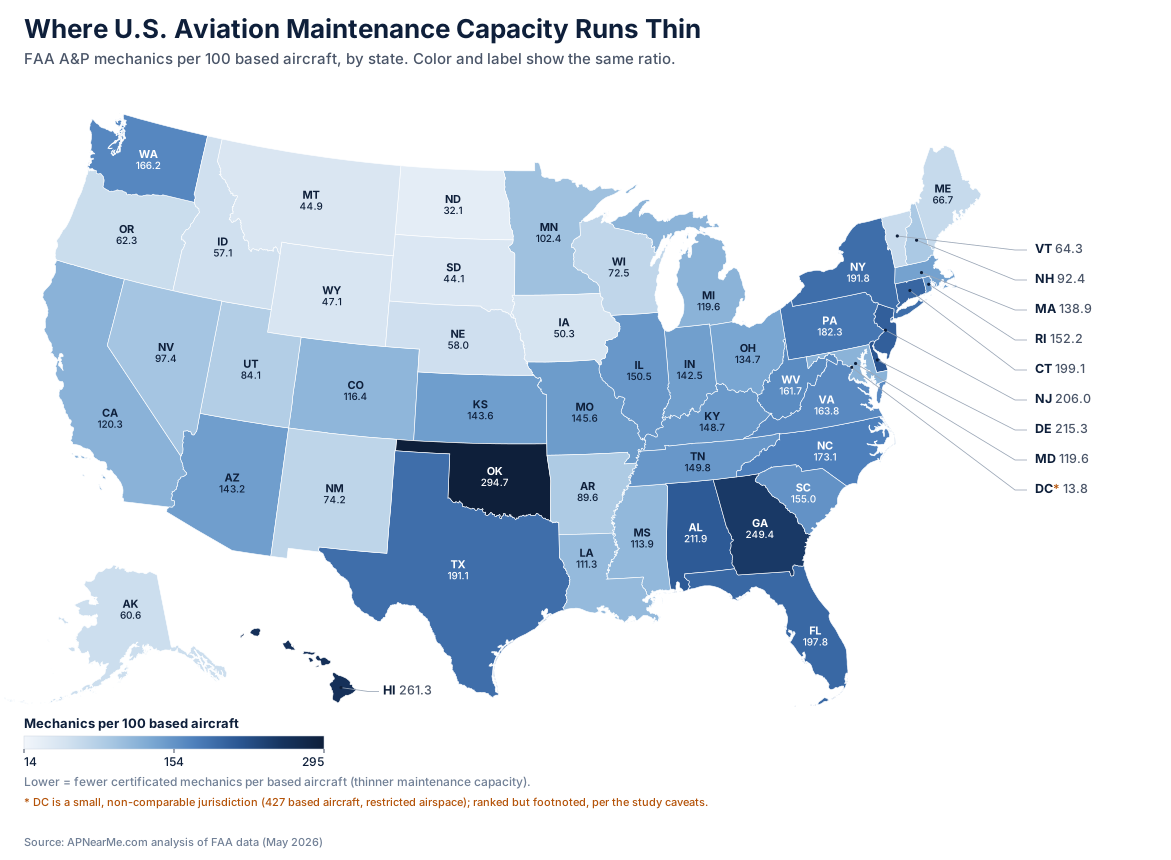
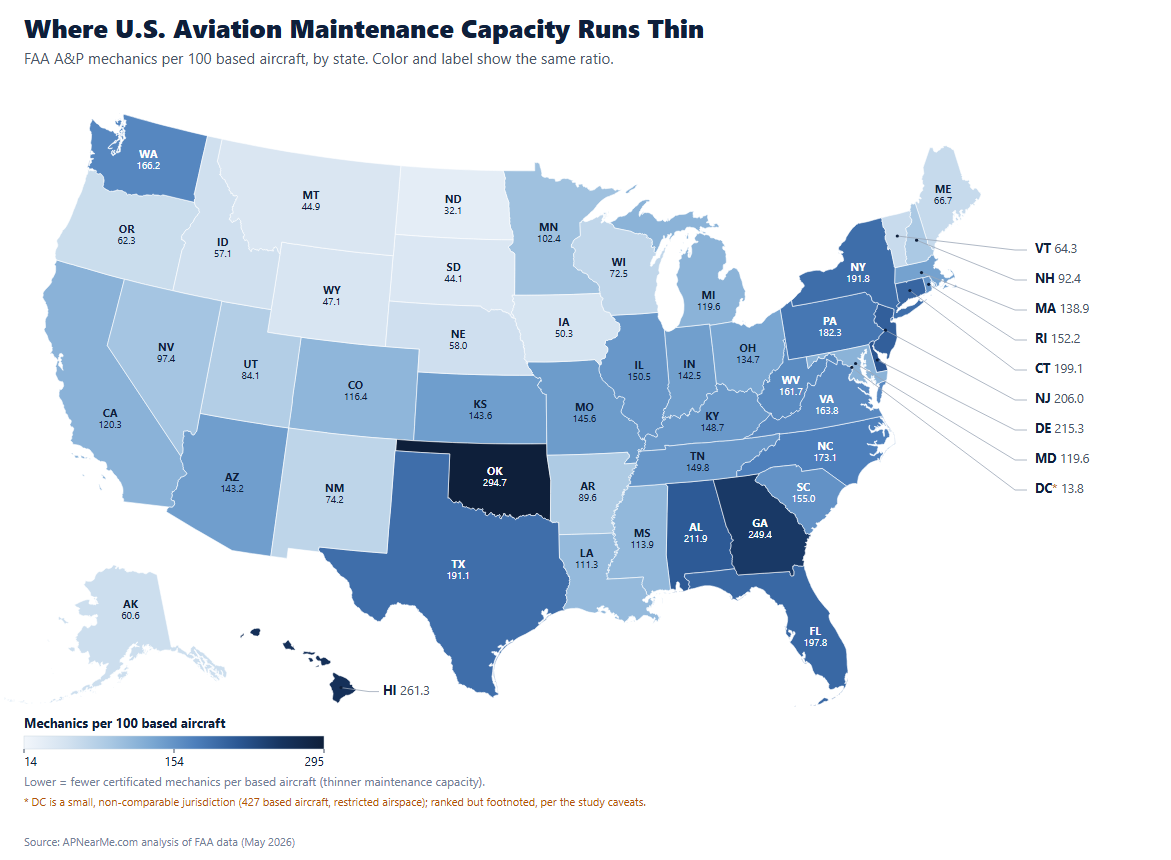
The FAA has certificated mechanics on file in every state, but they are not spread anywhere close to evenly against the aircraft that need them. Dividing FAA-certificated A&P mechanics by FAA-tracked based aircraft, state by state, produces a national average of 139.9 mechanics per 100 based aircraft and a range that runs from 13.8 in District of Columbia to 294.7 in Oklahoma.
Headline Numbers
139.9
Mechanics per 100 Based Aircraft
233,940
A&P Mechanics (study snapshot)
167,233
Based Aircraft
3,319
Tracked Airports
51
States & DC Ranked
The live A&P Near Me data hub currently counts 233,886 certificated mechanics nationwide. This study is a dated snapshot (FAA cycle CS052026, pulled 2026-06-11) that counts 233,940, a 0.02% drift from ordinary monthly refresh timing. The per-state ratios below are stable to the precision shown; for the current running total, see the live data hub.
Two Ways to Read the Map
The Thin-Capacity Story and the MRO-Hub Story
Angle 1 · Rural Coverage
Thin capacity in the Plains and Mountain West
Aircraft owners in the rural Plains and Mountain West have the fewest certificated mechanics for every based aircraft. 7 states, plus the District of Columbia (a special case, see caveats below), sit under 60 mechanics per 100 based aircraft:
- 1. District of Columbia †13.8
- 2. North Dakota 32.1
- 3. South Dakota 44.1
- 4. Montana 44.9
- 5. Wyoming 47.1
- 6. Iowa 50.3
- 7. Idaho 57.1
- 8. Nebraska 58
Angle 2 · The Counterintuitive Hook
Oklahoma has more A&P mechanics than New York
Certificate holders do not cluster by population or by where general-aviation aircraft are based: they cluster around airline and MRO maintenance bases. Oklahoma counts 9,140 A&P mechanics on file, more than 7,222 in New York, because American Airlines' Tulsa maintenance base pulls certificate holders' mailing addresses into Oklahoma. Georgia shows the same effect around Delta TechOps' Atlanta base, landing at 249.4 mechanics per 100 based aircraft, roughly 1.8x the national average. The five densest states:
- Oklahoma294.7
- Hawaii261.3
- Georgia249.4
- Delaware215.3
- Alabama211.9
Full Ranking
A&P Mechanics per 100 Based Aircraft, All 50 States & DC
Ranked thinnest first (rank 1 = fewest mechanics per based aircraft). District of Columbia is ranked but footnoted† as a special case; see caveats.
| Rank | State | A&P Mechanics | Based Aircraft | Per 100 Based | Per 100 Registered |
|---|---|---|---|---|---|
| 1 | District of Columbia† | 59 | 427 | 13.8 | 16.3 |
| 2 | North Dakota | 522 | 1,627 | 32.1 | 21.6 |
| 3 | South Dakota | 568 | 1,288 | 44.1 | 25.7 |
| 4 | Montana | 1,154 | 2,573 | 44.9 | 19.7 |
| 5 | Wyoming | 484 | 1,028 | 47.1 | 15.6 |
| 6 | Iowa | 1,156 | 2,300 | 50.3 | 27 |
| 7 | Idaho | 1,712 | 2,998 | 57.1 | 41.6 |
| 8 | Nebraska | 1,045 | 1,802 | 58 | 36.8 |
| 9 | Alaska | 2,955 | 4,879 | 60.6 | 32.8 |
| 10 | Oregon | 2,549 | 4,094 | 62.3 | 36.9 |
| 11 | Vermont | 266 | 414 | 64.3 | 39.9 |
| 12 | Maine | 639 | 958 | 66.7 | 45.5 |
| 13 | Wisconsin | 2,983 | 4,114 | 72.5 | 49.4 |
| 14 | New Mexico | 1,251 | 1,687 | 74.2 | 40.9 |
| 15 | Utah | 1,889 | 2,246 | 84.1 | 22.8 |
| 16 | Arkansas | 2,171 | 2,423 | 89.6 | 63.4 |
| 17 | New Hampshire | 881 | 953 | 92.4 | 58.3 |
| 18 | Nevada | 2,552 | 2,620 | 97.4 | 56.3 |
| 19 | Minnesota | 4,336 | 4,236 | 102.4 | 68.1 |
| 20 | Louisiana | 2,589 | 2,327 | 111.3 | 71.1 |
| 21 | Mississippi | 1,902 | 1,670 | 113.9 | 74.4 |
| 22 | Colorado | 5,438 | 4,673 | 116.4 | 74.5 |
| 23 | Maryland | 2,237 | 1,871 | 119.6 | 96.2 |
| 24 | Michigan | 5,324 | 4,450 | 119.6 | 75.6 |
| 25 | California | 21,454 | 17,834 | 120.3 | 82.6 |
| 26 | Ohio | 5,915 | 4,391 | 134.7 | 70.8 |
| 27 | Massachusetts | 2,394 | 1,724 | 138.9 | 90.8 |
| 28 | Indiana | 4,781 | 3,356 | 142.5 | 86.7 |
| 29 | Arizona | 7,561 | 5,281 | 143.2 | 91.5 |
| 30 | Kansas | 3,567 | 2,484 | 143.6 | 67.1 |
| 31 | Missouri | 4,243 | 2,914 | 145.6 | 74.6 |
| 32 | Kentucky | 2,740 | 1,843 | 148.7 | 93.4 |
| 33 | Tennessee | 5,530 | 3,692 | 149.8 | 86.1 |
| 34 | Illinois | 5,868 | 3,900 | 150.5 | 74 |
| 35 | Rhode Island | 204 | 134 | 152.2 | 56.5 |
| 36 | South Carolina | 3,391 | 2,188 | 155 | 110.9 |
| 37 | West Virginia | 1,012 | 626 | 161.7 | 115.3 |
| 38 | Virginia | 4,224 | 2,578 | 163.8 | 71.4 |
| 39 | Washington | 8,801 | 5,296 | 166.2 | 86.6 |
| 40 | North Carolina | 6,867 | 3,966 | 173.1 | 98.2 |
| 41 | Pennsylvania | 5,955 | 3,267 | 182.3 | 97.3 |
| 42 | Texas | 25,998 | 13,605 | 191.1 | 89.5 |
| 43 | New York | 7,222 | 3,766 | 191.8 | 109.6 |
| 44 | Florida | 23,964 | 12,113 | 197.8 | 113.4 |
| 45 | Connecticut | 1,941 | 975 | 199.1 | 121.4 |
| 46 | New Jersey | 3,348 | 1,625 | 206 | 110.7 |
| 47 | Alabama | 5,824 | 2,748 | 211.9 | 136.4 |
| 48 | Delaware | 760 | 353 | 215.3 | 7 |
| 49 | Georgia | 13,035 | 5,226 | 249.4 | 155.5 |
| 50 | Hawaii | 1,539 | 589 | 261.3 | 223 |
| 51 | Oklahoma | 9,140 | 3,101 | 294.7 | 165.9 |
Territories are not part of the 50-state + DC ranking above and are listed separately.
| Territory | A&P Mechanics | Based Aircraft | Per 100 Based |
|---|---|---|---|
| American Samoa (territory) | 9 | 4 | 225 |
| Guam (territory) | 208 | 44 | 472.7 |
| Northern Mariana Islands (territory) | 13 | 31 | 41.9 |
| Puerto Rico (territory) | 686 | 475 | 144.4 |
| U.S. Virgin Islands (territory) | 58 | 115 | 50.4 |
Methodology
Based Aircraft, Not Registrations
Numerator. FAA-certificated A&P mechanics, counted from the FAA Airmen Certification Database (cycle CS052026) by mailing-address state, de-duplicated by unique airman ID. A&P status requires both an Airframe rating and a Powerplant rating on the certificate.
Denominator. Aircraft based at the 3,319 airports the FAA tracks in its Terminal Area Forecast (TAF/NPIAS), year-2024 actuals, joined to state by airport location.
Why based aircraft, not registrations. Aircraft-registration counts by state are distorted by trustee and LLC registration structures that have nothing to do with where a plane actually sits. Delaware is the clearest case: 10,821 valid FAA registrations list a Delaware address, but only 353 aircraft are actually based there, a 31x gap. Per 100 registered aircraft, Delaware looks like one of the thinnest states in the country (7); per 100 based aircraft it is one of the densest (215.3). Utah shows a milder version of the same distortion: 8,270 registrations against 2,246 based aircraft. This study leads with based aircraft and reports the registration-based ratio only as a secondary column, for exactly this reason.
Read This Before You Cite It
Four Caveats
- This study counts certificated mechanics, not available mechanics. Mechanic counts are certificate holders by mailing address, so the total includes airline mechanics, retirees, and instructors who are not necessarily doing general-aviation work, and it assigns hub-state employment to people who live near an MRO base. That is what makes the Oklahoma and Georgia numbers a story instead of an error, but it means a high ratio is a measure of certificated supply, not of appointment availability at your local shop.
- Based aircraft covers the 3,319 FAA TAF/NPIAS-tracked airports, not private landing strips. It is the standard state-level measure, but it slightly undercounts states with many residential airparks.
- District of Columbia is a special case: 427 based aircraft spread across three airports' worth of restricted airspace. It is ranked in the table above, but should be read as a footnote, not a normal data point.
- This study draws on the same national FAA source files apnearme.com's live directory is built from, now covering the United States. Read the numbers here as the dataset behind apnearme.com, not as a separate one-off analysis.
Get the Data
The Dataset Behind This Study
The mechanic counts behind this study are the same FAA-public-domain records that power apnearme.com/data, the live A&P Near Me data hub. Free to use with attribution; please cite as "A&P Near Me, apnearme.com/study/mechanics-per-aircraft."